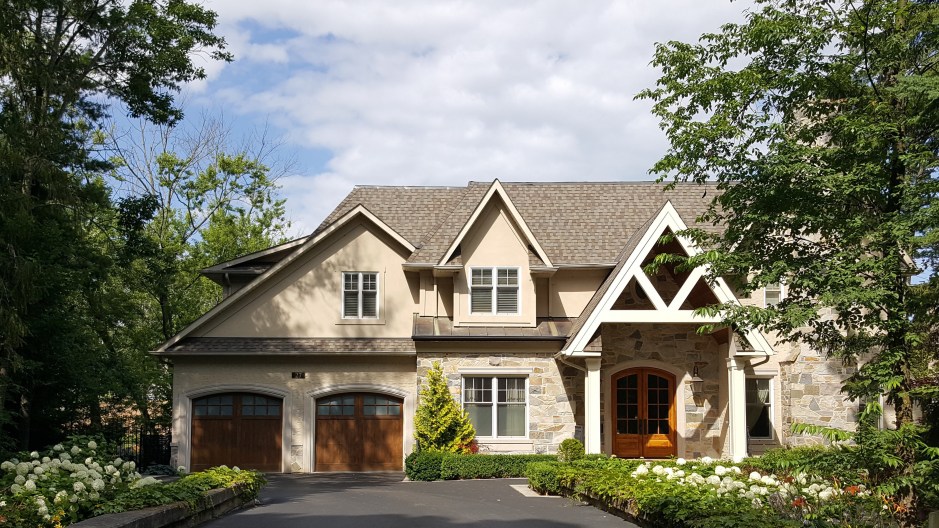
The theme for housing in Montgomery County remain consistent. Supply is down and houses are selling faster and for more. Weather could be a factor as we head into the slowest months of the year for real estate transactions, but signs are pointing toward a robust Spring market.
Comparison to last year
Through the 3rd quarter of 2017, the supply of homes coming to market continues to be sluggish across Montgomery County, down by 164 year-over-year, continuing a trend we have seen for a couple of years now. As a result, we are seeing homes sell quicker and sell for more than last year. The average sales price is up by nearly $6k, and the average number of days on market is down by about 4 days. Clearly, the market has shifted to being more seller-friendly, but there is still considerable value to be found for buyers.
Prediction for Montgomery County 4th Quarter 2017 Housing Market
Winter tends to be the slowest time of the year for home sales. This phenomenon tends to be exacerbated when bad weather is involved, and heavier than average snow totals are what our local meteorologists are predicting. All of these factors lead me to believe that the 4th quarter of 2017 will be even more of the same. The seasonal winter slowdown, compounded by continued lack of inventory should keep prices up and days on market low, and prepare us for a healthy Spring housing market..
Want to know how your area compares? Check out the most popular cities in Montgomery County.
| Potomac | 3rd Qtr. 2016 | 3rd Qtr. 2017 |
| Number of Homes Sold | 183 | 160 |
| Average Days on Market | 72 | 67 |
| Average Sold Price | $1,004,929 | $1,015,322 |
Homes in Potomac are sitting on the market longer than the D.C. regional average of 48 days2 and have increased a bit from Quarter 2. Given the average sales price of over $1 million and the current home market is leaning towards a more urban communities it is expected that home sales are a bit sluggish in this area.
| Gaithersburg | 3rd Qtr. 2016 | 3rd Qtr. 2017 |
| Number of Homes Sold | 432 | 456 |
| Average Days on Market | 45 | 39 |
| Average Sold Price | $429,439 | $433,686 |
Homes in the 20879 zip code have seen a 10.2% increase in average sales since last year. Hyde Park, Goshen Village, and Meadowvale subdivisions showing the highest increases.
| Rockville | 3rd Qtr. 2016 | 3rd Qtr. 2017 |
| Number of Homes Sold | 452 | 433 |
| Average Days on Market | 40 | 42 |
| Average Sold Price | $484,032 | $478,400 |
Rockville average sold price continues to remain steady with very small increase of 1.5% since last year. Zip code 20851 has seen the strongest increase of 6% since last year with Rockland and Twinbrook subdivisions having the largest increases.
| Germantown | 3rd Qtr. 2016 | 3rd Qtr. 2017 |
| Number of Homes Sold | 335 | 335 |
| Average Days on Market | 43 | 37 |
| Average Sold Price | $305,161 | $328,236 |
Germantown continues to be a hot market. Not only did the number of homes stay the same as compared to last year but the number of Days on Market decrease while the Average Sold Price increased over $13k. The subdivisions of Spring Meadows and Blunt Commons are leading the average sold price in all the Germantown zip codes.
I’d love to hear your thoughts about what may be affecting the Montgomery County Housing Market. Don’t see your city listed? Contact me to discuss your neighborhood.
All data pulled from MarketStats by ShowingTime