Montgomery County continues to be one of the strongest housing markets in the D.C. Metro area. After a sluggish start in the first quarter of 2017, the housing market rebounded as a shortage of homes for sale drove prices up and the number of days homes stay on the market (Days On Market) down.
Comparison to last year
Despite the uptick in home sales for Quarter 2, the number of homes sales year-to-date in 2017 are down to 3,954, as compared to 4,058 homes in the same period of 2016. However, the average sold price increased to $545,547 from $529,048 last year. Additionally, days on market decreased to 39 days, from 47 days last year. This was primarily due to fewer homes on the market (5,576) compared to last year’s 2nd Quarter (5,943).
Here are the most popular cities in Montgomery County compares:
| Potomac |
2nd Qtr. 2016 |
2nd Qtr. 2017 |
| Number of Homes Sold |
230 |
200 |
| Average Days on Market |
67 |
65 |
| Average Sold Price |
$1,019,793 |
$1,052,455 |
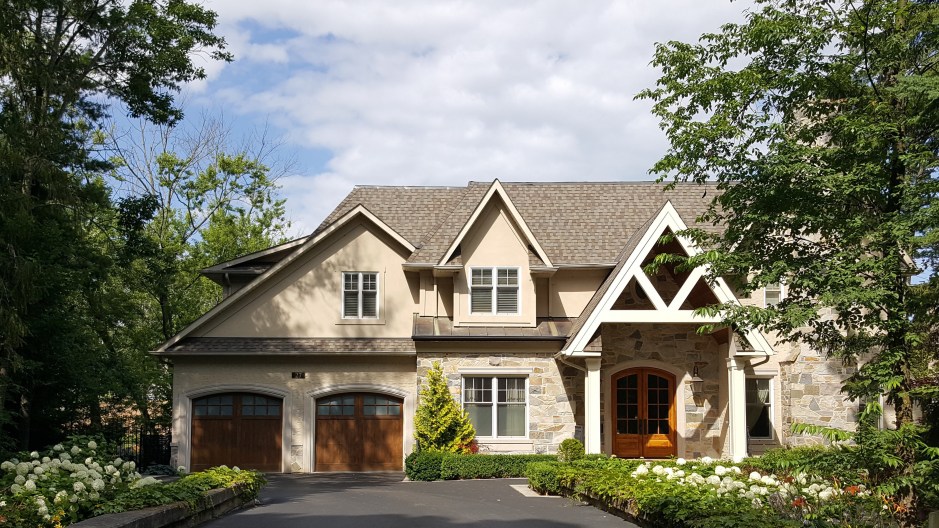
Potomac, MD home sales have started to rebound since the crash of 2009. Homes here are sitting on the market longer than the D.C. regional average of 44 days, but this is to be expected, given the average sales price of over $1 million.
| Gaithersburg |
2nd Qtr. 2016 |
2nd Qtr. 2017 |
| Number of Homes Sold |
533 |
516 |
| Average Days on Market |
51 |
33 |
| Average Sold Price |
$434.487 |
$452,141 |
New Homes Developments in Gaithersburg, MD have been a good boost to home prices in the area. New Construction sites include Downtown Crown and Parklands. Homes in Downtown Crown include condos, townhomes, and single family. This area has become a new focal point in the area, with its vibrant restaurant and event scene. Homes in Parklands include townhomes and single family homes.
| Rockville |
2nd Qtr. 2016 |
2nd Qtr. 2017 |
| Number of Homes Sold |
514 |
523 |
| Average Days on Market |
37 |
33 |
| Average Sold Price |
$495,313 |
$506,288 |
Rockville has seen an increase in the number of homes sold and a drop in the average days on market. This should be no surprise with the convenience of Metro, new development in King Farm and Westside at Shady Grove, and the bustling Rockville Town Center.
| Germantown |
2nd Qtr. 2016 |
2nd Qtr. 2017 |
| Number of Homes Sold |
397 |
359 |
| Average Days on Market |
48 |
33 |
| Average Sold Price |
$326,107 |
$323,740 |
Germantown continues to be an economical area to purchase a home, and is a great place to consider buying if you’re looking for a little bang for your buck. It has slumped a bit this Quarter, but that means great deals can be found. While Germantown’s number of homes sold and the Average Sold Price is down modestly, the market here is primed for opportunistic buyers and sellers.
| Bethesda |
2nd Qtr. 2016 |
2nd Qtr. 2017 |
| Number of Homes Sold |
396 |
410 |
| Average Days on Market |
47 |
52 |
| Average Sold Price |
$1,003,848 |
$974,732 |
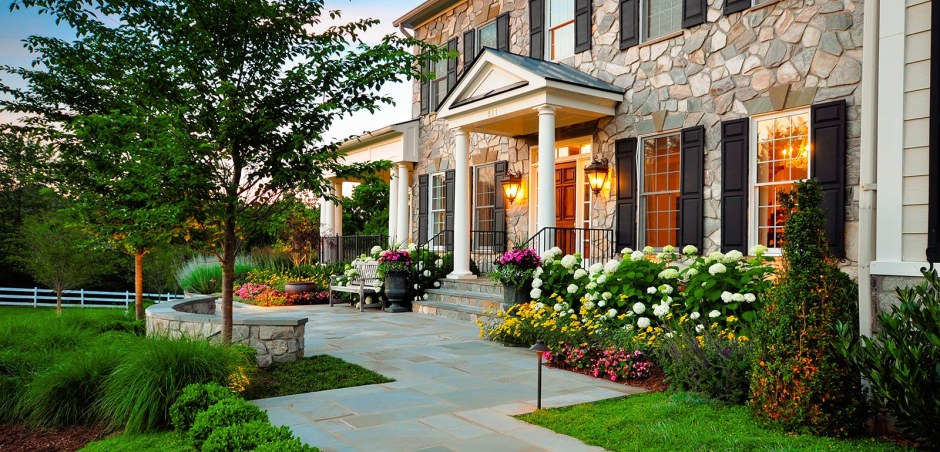
Last year’s Quarter 2 Average Sold Price seems to be an anomaly at $1,003,848. In the last 10 years, no Quarter reached over $1M. This can likely be attributed to the types of homes that were selling last year, including high-end developments like Pike & Rose. Bethesda is constantly reinventing itself with teardowns, new developments and a wealth of shopping and upscale urban living amenities. Bethesda continues to be a prime location for local residents, and that’s a trend we won’t soon see reversed.
| Takoma Park |
2nd Qtr. 2016 |
2nd Qtr. 2017 |
| Number of Homes Sold |
63 |
65 |
| Average Days on Market |
36 |
41 |
| Average Sold Price |
$505,402 |
$482,948 |
Data doesn’t lie, but I’d say the data on Takoma Park is a little misleading. Takoma Park has historically been a bit of a mixed bag as it relates to real estate, but it has been evolving rapidly over the past several years. Locals love the vibrant arts scene, diverse and “earthy” culture, small town feel, and all so near to Downtown. Not only is Takoma Park emerging as one of the coolest places for young families and first-time buyers to call home, but its affordability makes it attractive to investors and value shoppers, as well.
| Silver Spring |
2nd Qtr. 2016 |
2nd Qtr. 2017 |
| Number of Homes Sold |
981 |
958 |
| Average Days on Market |
40 |
32 |
| Average Sold Price |
$386,124 |
$408,465 |
Silver Spring’s central location, with easy access to both D.C. and Baltimore, is a primary reason this area has consistently been a popular place to call home. The rejuvenation efforts that began several years ago have completely transformed Downtown Silver Spring and attracted some large corporations. Quality of life, great location, and good jobs means Silver Spring will continue to be an appealing neighborhood for Maryland residents.
Prediction for Montgomery County 3rd Quarter 2017 Housing Market
During the summer months housing sales typically slow down as many people are on vacation. Summer vacation season means there’s less homes on the market and fewer people to view those homes. However, as school approaches the market usually sees a bump in sales as families are planning moves right before school starts. This Autumn bump tends to be smaller than Spring. My prediction for Quarter 3 will be for real estate markets to remain true to these seasonal trends due to the shortage of homes on the market. I believe the total of number of homes sold will be less than last year, and as we’ve already seen this year, home sale prices will continue to increase and days on market will decrease or remain steady.
I’d love to hear your thoughts about what may be affecting the Montgomery County Housing Market. Don’t see your city listed? Contact me to discuss your neighborhood.